creating-dashboards.rst
37 lines
| 1.3 KiB
| text/x-rst
|
RstLexer
Creating Custom Dashboards
Important
To generate custom dashboards you need to use the |RAE| Logging API to export the data you want to chart. See the example scripts for doing this in the :ref:`log-script-eg` section.
To create a custom dashboard, use the following steps.
- From the |RAE| home page, select :menuselection:`Charts --> Custom Dashboards --> Create Dashboard`
- Add a name in the :guilabel:`Dashboard title` files and save the chart. Then you can click on the :guilabel:`Configure Chart` button to start creating it.
- Configure the following basic chart settings:
- The :guilabel:`Application` from which the data is being monitored.
- Select the :guilabel:`Chart Type`.
- Choose between a :guilabel:`Timeseries histogram` or a :guilabel:`Terms` based chart.
- Select the :guilabel:`Aggregation type` from the drop down menu
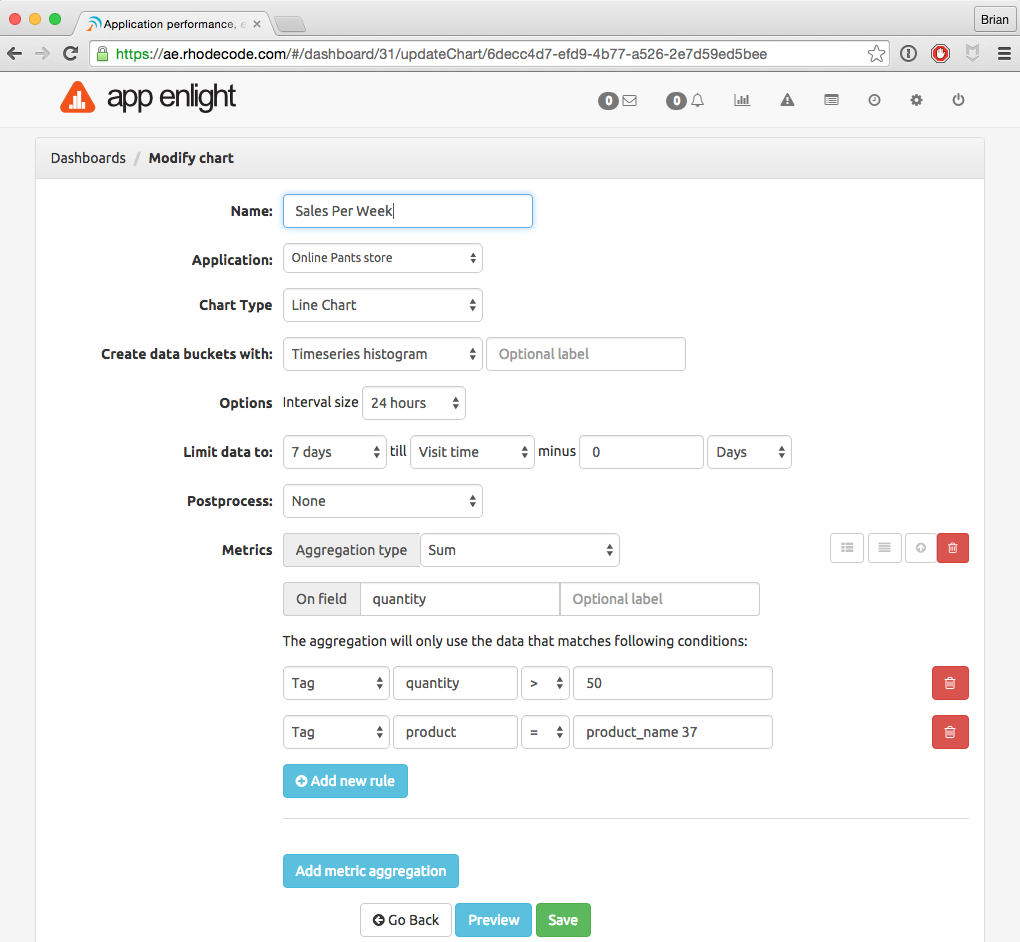
- From here on, it depends on what data is being used. In the following
example, this is being calculated:
- the sum of sales in which the quantity of items sold was over 50
- for product_name 37
- over the last 7 days